
Amazon AWS Revenue Surges 37% as AI Spending Hits Cash Flow: What It Means for Crypto in 2026
Bitget reports Amazon AWS revenue grew 37% while AI CapEx turned trailing free cash flow negative, shaping key stock levels and crypto macro risk sentiment.
On September 1, 2026, cryptocurrency exchange operator Bitget released a financial disclosure on X via its dedicated TradFi account (@Bitget_TradFi). The post detailed the latest quarterly operational performance of Amazon Web Services (AWS) and analyzed how heavy capital expenditure on artificial intelligence infrastructure compressed corporate liquidity. Furthermore, the analysis established key technical chart levels for Amazon stock, highlighting how balance sheet pressures on Big Tech hyperscalers impact cross-asset risk sentiment across both traditional equities and digital asset markets.
AWS Revenue Surge vs. AI CapEx Drag: Core Financial Findings
Amazon Web Services delivered a 37% year-over-year revenue increase in its latest quarter, achieving its fastest quarterly expansion rate in 18 quarters. This growth demonstrates sustained enterprise demand for cloud infrastructure and computing services, confirming robust top-line momentum in Amazon's core digital business.
However, accelerated capital expenditures (CapEx) aimed at scaling artificial intelligence compute capacity severely constrained corporate liquidity. Substantial cash outflows pushed Amazon's trailing free cash flow into negative territory, highlighting a clear divergence between rapid cloud revenue growth and short-term balance sheet cash generation.
This cash flow drag reveals the immediate financial trade-offs hyperscalers face when prioritizing aggressive AI infrastructure expansion. Although revenue expansion demonstrates resilience, substantial CapEx commitments temporarily elevate balance sheet leverage and reduce operational cash reserves.
Viewed from the infrastructure side, **Amazon's role in the 2026 AI compute stack** extends beyond AWS revenue because Trainium, custom silicon, data-center capacity and hyperscaler CapEx all affect the economics of AI deployment.
Technical Analysis of Amazon Stock: Key Support and Resistance Boundaries
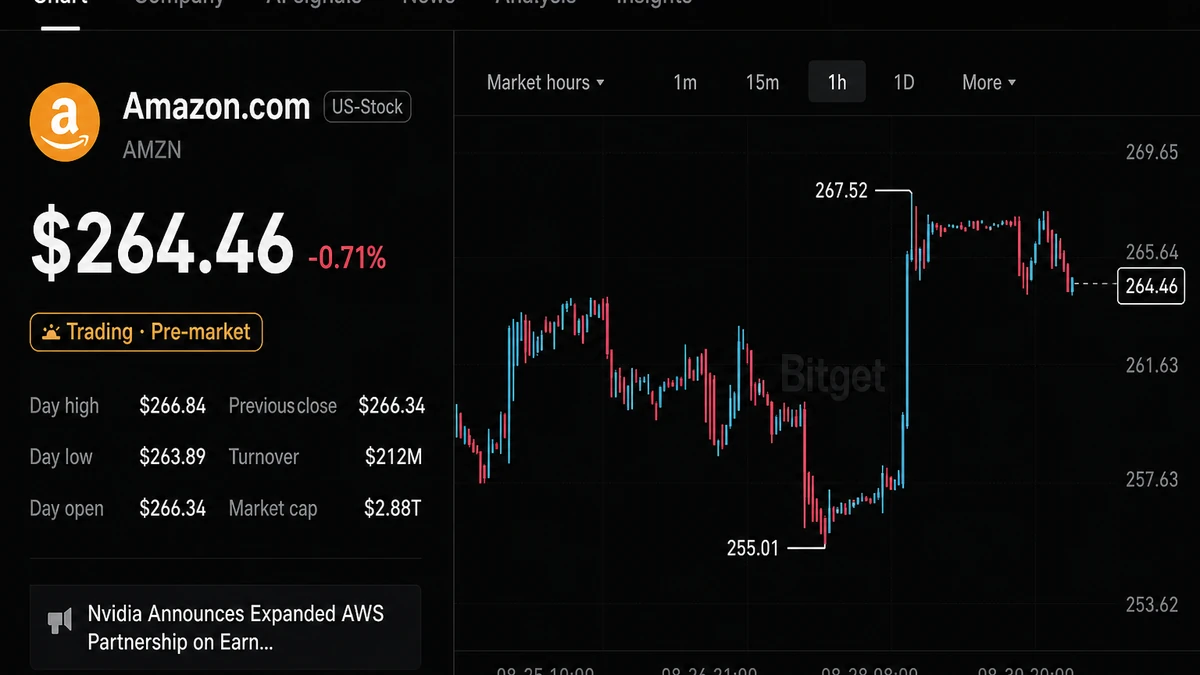
From a technical perspective, Amazon's stock price structure needs to hold firmly within the $255–$260 support zone to maintain its broader bullish chart pattern. Keeping price above this baseline band prevents structural breakdowns and absorbs recent market selling pressure.
The $270 level represents a primary technical resistance boundary and key breakout trigger point. A decisive close above $270 would validate upside momentum, signaling potential trend continuation toward higher valuation targets.
Conversely, a sustained drop below the critical $250 support level would invalidate the short-term bullish structure. Such a breakdown would open up immediate technical downside toward $239, which marks the next major structural support floor monitored by market participants.
Big Tech Free Cash Flow Strain and Macro Risk Sentiment
The financial dynamics surrounding Amazon reflect a broader cycle across Big Tech balance sheets, where massive capital reallocations toward AI hardware and data center expansion pressure free cash flow trajectories. When revenue growth is offset by negative cash flows, market sensitivity to capital allocation risks rises significantly.
This shift in corporate spending carries direct macro implications for cross-asset liquidity. As hyperscaler stocks absorb substantial capital to fund infrastructure upgrades, global risk appetite faces a tighter environment, impacting crypto market risk sentiment. Shifts in corporate cash management often ripple into broader digital asset markets, as seen in the Bitget and Bybit derivatives restructuring.
Key Technical Watchpoints and Market Triggers for Traders
Traders and market participants should closely monitor daily price action near Amazon's $255–$260 support band and the $270 resistance level. A sustained close above $270 confirms a bullish continuation, while a breach below $250 signals downside toward $239.
Subsequent corporate earnings updates and management disclosures regarding AI infrastructure commitments will remain vital for evaluating free cash flow recovery timelines and corporate risk appetite. These updates will clarify whether CapEx is beginning to yield positive operational returns or continuing to drag on liquidity.
For cross-asset traders navigating macroeconomic spillovers between traditional equities and crypto, tracking exchange consolidation trends provides broader market context. Investors seeking to monitor multi-asset exposure across equities and digital assets can explore real-time market tools on MSX.
Frequently asked questions
How fast did Amazon AWS revenue grow according to the disclosure?
Amazon AWS achieved a 37% year-over-year revenue increase, marking its fastest quarterly growth rate in 18 quarters.
Why did Amazon's trailing free cash flow turn negative?
Accelerated capital expenditure on artificial intelligence infrastructure compressed liquidity, pushing trailing free cash flow into negative territory despite strong top-line revenue growth.
What are the key technical support and resistance levels for Amazon stock?
Key support sits between $255 and $260, with resistance at $270. A breakdown below $250 invalidates near-term support, targeting $239.
How does Amazon's AI spending affect crypto market sentiment?
When hyperscaler balance sheets face free cash flow strain from AI CapEx, global risk appetite can tighten. That can reduce cross-asset liquidity and increase volatility in crypto markets alongside traditional equities.
What should traders monitor after this AWS disclosure?
Watch Amazon's $255–$260 support and $270 resistance, upcoming earnings commentary on AI CapEx, and whether Big Tech cash flow pressure spills over into broader crypto risk sentiment.

Report the page and describe what should be reviewed.